Vapor Pressure Curves: Phase Diagrams for Vaporization
Phase Diagrams for Vapor Pressure Curves
While phase diagrams are primarily used by chemists in laboratory environments, these tools are astonishingly useful for mechanical engineers and plant managers tasked with sample analysis. In some analytical systems, a liquid sample must be converted to gas through vaporization before it can be analyzed. The vaporization process is essentially a balancing act between temperature, pressure and flow variables – and a phase diagram’s vapor pressure curves allow engineers to identify phase changes for distinct materials and chemical compounds. Understanding this phase diagram vapor pressure relationship is key.
Our local sales and service centers have specialists that can help.
How to Read a Vapor Pressure Curve
For example, a hypothetical gas mixture of 20% hexane in pentane will be applied as a complete phase diagram (see vapor pressure graph below). When the sample is above the bubble point (blue line), it will be entirely in the liquid phase. A sample must remain in its liquid state as it enters the vaporizer. When a sample is below the dew point (gold line), it’s all vapor. The sample must be all vapor when it leaves the vaporizer.
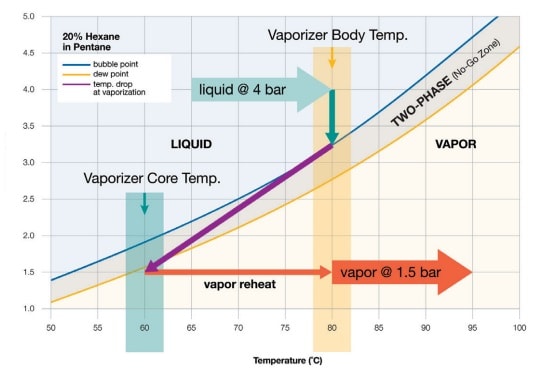
Between the bubble point and dew point lines is the “no-go zone.” This zone represents the boiling range of the sample. Here, the mixture is in two phases: part liquid and part vapor. Once a sample falls into the no-go zone, it is fractionated and no longer suitable for analysis. The objective of vaporization is to set the temperature, flow and pressure so that the sample skips instantly from the liquid side of the no-go zone to the vapor side. With pure and nearly pure samples, there is little to no boiling range or no-go zone. The bubble point and dew point lines are simply on top of each other or nearly so.
Pure and nearly pure samples will convert to vapor of the same composition, whether through evaporation or vaporization. Some industrial samples approach this level of purity and convert fairly easily. On the other hand, some samples have such a wide boiling range or no-go zone that they cannot be successfully vaporized. There is no way for such samples to skip from the liquid side of the no-go zone to the vapor side. In this case, variables cannot be manipulated to avoid fractionation.
In the vapor pressure graph shown above, the band between bubble point and dew point is narrow enough that with the proper settings, the sample can effectively skip from the liquid side of the no-go zone to the vapor side. At the same time, the band in the diagram is wide enough that one cannot afford to be careless.
Setting Temperature, Pressure, and Flow Parameters for Vaporization Processes
Continuing to work with the sample in the diagram (20 percent hexane in pentane), inputs for temperature control, pressure control and flow control need to be skillfully set to ensure a successful vaporization process, as guided by the vapor pressure curve. In general, high pressure and low temperature are needed at the inlet. Conversely, at the outlet, high temperature and low pressure are necessary. There are limits as to how high and low these parameters can be, and not every constraint can be controlled.
-
Calculate Inlet Pressure for Your Vaporizer
The inlet pressure, which is fixed, is the process pressure—provided that the vaporizer is located near to the sample tap. In the example diagram, that pressure is 4 bar. Higher pressure is better because it allows the vaporizer to keep the temperature higher without boiling the incoming liquid.
-
Set Inlet Temperature for Complete Vaporization
When setting the inlet temperate, there are two objectives. First, the temperature must be low enough that when the sample enters the vaporizer, it is entirely a liquid. In the example diagram, the bubble point at 4 bar is 88°C. To guard from fractionation, it is best to choose a round number far enough away from 88°C to avoid the no-go zone. A safe example temperature could be 80°C.
The second objective is to keep the temperature high enough to contribute to the complete flashing of the sample—ensuring only vapor leaves the vaporizer. When vaporizing a sample, the temperature drops in accordance with the laws of energy conservation. The sample temperature must be high enough at the outset so that after the pressure drop the sample does not fall in the no-go zone. In the example diagram, the vapor temperature after the pressure drop is 60°C—just on the vapor side of the dew point line.
-
Adjust Outlet Pressure for Proper Sample Vaporization
When setting the outlet pressure, the objective is to drop the pressure below the dew point line. In the example diagram, the outlet pressure is set to 1.5 bar. If the outlet pressure were any higher, the sample would not vaporize entirely and would fractionate.
-
Control Flow Rate with Valves and Rotameters
Flow is set downstream at a valve and rotameter, not at the vaporizer. In a sampling system, high vapor flow is desirable because it moves the sample to the analyzer faster. However, high flow can be problematic because more heat is required to vaporize the sample. In other words, high flow results in a greater drop in temperature at the time of vaporization. In the example diagram, the purple line illustrates the temperature drop. As the flow increases, the temperature drops sharply.
Another variable influencing the temperature drop is the heat transfer capability of the vaporizer. Some vaporizers are constructed in such a way that heat transfers more efficiently to the sample. When the liquid sample converts to vapor and its temperature drops, it draws heat from the stainless steel surrounding it. The critical question is how efficiently the vaporizer can replace the heat and keep it flowing to the sample. The more heat the sample can draw, the less its temperature drops during vaporization. In some instances, it is possible for the vaporizer to be hot to the touch on the outside but cold at the core inside. That’s because the vaporized sample is drawing a high amount of heat and the vaporizer cannot transfer enough energy to keep up. The best solution is to reduce the flow.
In summary, the temperate drop visualized in the vapor pressure graph is a product of the flow rate and the heat transfer capability of the vaporizer. With a good quality vaporizer and low flow rate, the line in the diagram will become more vertical. Unfortunately, there is no easy way to calculate the precise location of the temperature drop within a phase diagram. This specific phase diagram vapor pressure relationship cannot be generated by any known software program. As a result, the vaporization process involves some approximation. As a rule of thumb, keep the flow rate as low as possible without causing an unacceptable delay in the sample’s travel time to the analyzer. It’s better to start with a low flow rate and experiment by increasing it than to start with an initially higher flow rate.
For additional help with analytical instrumentation and sampling system best practices using phase diagram vapor pressure curves, please contact your local Swagelok sales and service center.
Sampling and Vaporization Process Articles
How to Position Nozzles in Your Liquid & Natural Gas Sampling System
Discover why nozzle placement matters in LNG sampling systems. Learn best practices to ensure accurate, representative samples and avoid costly errors in your natural gas analysis process.
How to Manage Vaporization in Sampling Systems
Learn how to prevent fractionation and achieve accurate results when converting liquid samples to vapor in analytical systems. This guide explains vaporization basics, key variables, and best practices for reliable sampling performance.
10 Tips to Improve Sampling Systems
Boost sampling system performance with these ten practical tips. Learn how to reduce errors, improve accuracy, and keep your process reliable—all while saving time and resources.

